There are a few quite good articles that discuss the pros and cons of the Electoral College system better than I could.
http://www.uselectionatlas.org/INFORMAT ... procon.php
http://usinfo.state.gov/journals/itdhr/ ... ulness.htm
http://en.wikipedia.org/wiki/U.S._Elect ... al_College
http://en.wikipedia.org/wiki/U.S._Elect ... al_College
So in summary the presidential election was never designed to be a popular vote (one leg of the ‘checks and balances’ does that – sort of) but a mechanism to garner wide support across diverse geographical areas.
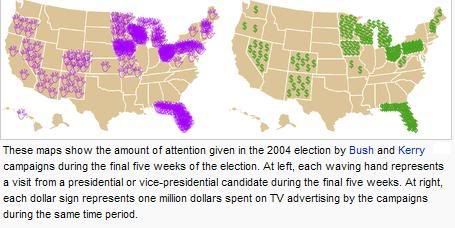
Never mind the election now being dominated by swing states now as opposed to urban areas, I did some analysis on the 2008 results. Oh boy does the present system come at a cost!
In the numbers below:
EC = the number of Electoral College votes
Voters = the number of registered voters as at 2004 – the latest reliable source (http://www.statemaster.com/graph/gov_20 ... red-voters)
Republican / Democrat = the number of votes cast (as of now)
EC Weighting = (Electoral College votes) / (Registered voters), compared with the national average. So in Wyoming a voter has in effect 3 times the effective strength compared with the US as a whole. Wisconsin has the weakest.
Code: Select all
State             EC       Voters  Republican    Democrat     EC Weighting

Alabama            9    2,418,000   1,264,879     811,764             0.98
Alaska             3      334,000     136,585      80,505             2.37
Arizona           10    2,485,000   1,131,790     948,066             1.06
Arkansas           6    1,328,000     632,672     418,049             1.19
California        55   14,193,000   4,144,693   6,765,199             1.02
Colorado           9    2,307,000   1,020,135   1,216,793             1.03
Connecticut        7    1,695,000     614,584     973,302             1.09
Delaware           3      415,000     152,356     255,394             1.91
Florida           27    8,219,000   3,939,380   4,143,957             0.87
Georgia           15    3,948,000   2,048,244   1,843,452             1.00
Hawaii             4      497,000     120,309     324,918             2.13
Idaho              4      663,000     400,989     235,219             1.59
Illinois          21    6,437,000   1,975,801   3,293,340             0.86
Indiana           11    3,031,000   1,341,667   1,367,503             0.96
Iowa               7    1,674,000     677,508     818,240             1.10
Kansas             6    1,338,000     685,541     499,979             1.18
Kentucky           8    2,231,000   1,050,599     751,515             0.95
Louisiana          9    2,413,000   1,147,603     780,981             0.98
Maine              4      824,000     296,195     421,484             1.28
Maryland          10    2,676,000     938,671   1,579,890             0.99
Massachusetts     12    3,483,000   1,104,284   1,891,083             0.91
Michigan          17    5,364,000   2,044,405   2,867,680             0.84
Minnesota         10    3,080,000   1,275,400   1,573,323             0.86
Mississippi        6    1,510,000     687,266     520,864             1.05
Missouri          11    3,336,000   1,444,289   1,439,321             0.87
Montana            3      519,000     241,816     229,725             1.53
Nebraska           5      918,000     446,039     324,352             1.44
Nevada             5      965,000     411,988     531,884             1.37
New Hampshire      4      716,000     316,937     384,591             1.48
New Jersey        15    4,085,000   1,545,495   2,085,051             0.97
New Mexico         5      936,000     343,820     464,458             1.41
New York          31    8,624,000   2,576,360   4,363,386             0.95
North Carolina    15    4,292,000   2,109,698   2,123,390             0.92
North Dakota       3      412,000     168,523     141,113             1.92
Ohio              20    6,003,000   2,502,218   2,708,988             0.88
Oklahoma           7    1,781,000     959,745     502,294             1.04
Oregon             7    2,049,000     699,673     978,605             0.90
Pennsylvania      21    6,481,000   2,586,496   3,192,316             0.86
Rhode Island       4      522,000     157,317     281,209             2.02
South Carolina     8    2,238,000   1,034,500     862,042             0.94
South Dakota       3      425,000     203,019     170,886             1.86
Tennessee         11    2,739,000   1,487,564   1,093,213             1.06
Texas             34    9,681,000   4,467,748   3,521,164             0.93
Utah               5    1,141,000     555,497     301,771             1.16
Vermont            3      354,000      96,458     203,952             2.24
Virginia          13    3,441,000   1,726,053   1,958,370             1.00
Washington        11    3,133,000   1,098,072   1,548,654             0.93
Washington, D.C.   3      293,000      14,821     210,403             2.70
West Virginia      5      935,000     394,278     301,438             1.41
Wisconsin         10    3,225,000   1,258,181   1,670,474             0.82
Wyoming            3      265,000     160,639      80,496             2.99

Total            538  142,072,000  57,838,800  66,056,046             1.00
OK, a bunch of numbers. What does it tell us?
First Past The Post
Firstly, the first past the post system where winner takes all in each state is deeply flawed. Only Maine and Nebraska use a form of proportional representation. In California over 4m people voted Republican but were not represented by any EC delegate. Across the country it added up to 52.3m people being effectively disenfranchised. That’s 42% of the people who voted. In the infamous 2000 election it was 'only' 47.7m people, but that represented 47.0% of all who voted.
Over 40% of the electorate disenfranchised? Whatever the pros and cons of the system, this is too much of a con, in more than one sense of the word.
Of course, there is a systematic flaw in the concept. Technically, and I stress technically, you could have had 11 people vote for one candidate (one in each of the 11 biggest states with no other vote cast), and over 64.7m vote for the other candidate in all the other States – and the 11 people would have won. Somewhat a reduction ad absurdum approach since it simply wouldn’t happen in real life, but it seems strange to have a system where technically it could.
We all know that in 2000 if just 500 voters had voted differently (Florida), Gore would have won the election. What about this year? Well, the minimum number of voters it would have required to vote differently for McCain to have won is just 604,000 - Colorado, Florida, Indiana, Iowa, New Hampshire, New Mexico, North Carolina, Ohio and Virginia. A majority of the EC, but only 47.7% of the popular vote. If instead of pure votes, we go by easiest swings – ie marginal seats – it’s not that much more. Only 694,000 votes – take New Mexico out of the list and replace it with Minnesota. This time that’s a whopping 47.8% of the popular vote.
Proportional Representation
If each state had apportioned the EC proportionally, Obama would have received 288 EC votes (53.5%) compared with 53.3% of the popular vote. Pretty close considering there is weighting for each state. And what about the 2000 election? Well no candidate would have received a majority (and Nadar would have received 7), it would have gone to the House of Representatives which was Republican at the time so Bush still would have won. Even taking the third party candidates out and apportioning the EC votes based purely on Rep / Dem votes incredibly it would have been a tie (269-269) and would again have gone to the House of Representatives.
Interesting to see that in both years, despite different weightings given to different states, using proportional representation within each state is very close to the overall popular vote.
Rural weighting
I did wonder if the weighting towards rural areas automatically skewed the EC in favour of the Republicans. Rural areas, with the population more spread out, tend to be more self-sufficient, less ‘community-minded’ and therefore tend to lean more to the Republicans. A simple analysis shows there is no significant correlation between the EC weighting and the Republican % in both 2008 and 2000 – even after taking out the anomalous Washington DC.
Of course, the US Senate, since it is just two per state no matter what the population in the state, has even more of a rural weighting and so is even worse.
I make no comment about using such weightings other than to say, well, it feels wrong. I reserve the right to form a more considered opinion later!
Voting Power
I did wonder whether the weightings gave even more power than one might initially think to any one state. Consider the following hypothetical: the US is made up of just two states, Virginia (3,441,000 voters and 13 EC votes from the above table) and Massachusetts (3,483,000 voters and 12 EC votes). Although the latter has more voters, it has no voting power whatsoever since whatever the Virginia voters decide will end up with the majority of the EC votes (13 out of 25). The voting power is Virginia 100% (13 votes), Massachusetts 0% (12 votes).
Let’s add another state into the mix – Rhode Island (522,000 voters and 4 EC votes). This time Virginia has a say in the matter, but no more than the other two! Any combination of two out of the three will produce a majority. The voting power is now Virginia 33% (13 votes), Massachusetts 33% (12 votes), and Rhode Island 33% (4 votes).
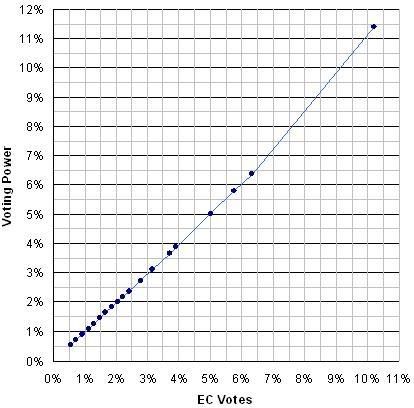
So how does it look like for all of the US? Well I ran the model and it turns out that there is no undue influence as a result. In fact the correlation between electoral votes and voting power is 99.8%. Only California has any meaningful voting power over and above the votes (11.4% of the power, 10.22% of the votes).

Conclusion
The Electoral College system certainly needs a fresh rethink. Personally, I’d go with proportional representation within each state, albeit a more direct version than that in Maine and Nebraska. As to the disproportionate weighting by state as a whole, I still have to think about that.


